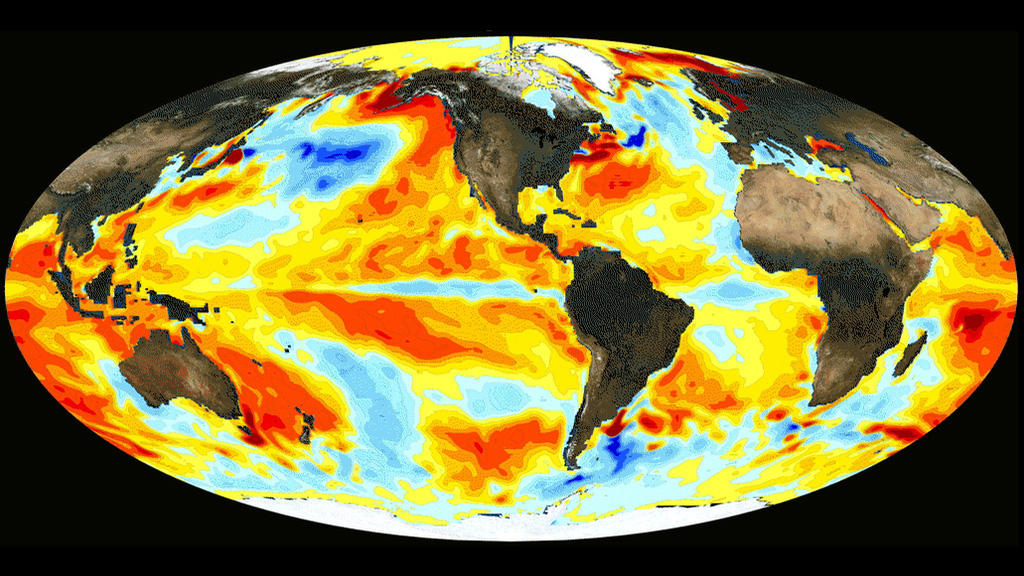
This video shows sea surface temperature changes from Jan. 2015 to Aug. 2016. Red, orange and yellow indicate areas that are warmer than normal.
> CONTACT & ABUSE <